
The trouble with radar charts is how useful they are. They give us a really easy way to draw shapes with data. This makes them really tempting to use to make small multiples, making a whole series of shapes so that we can quickly see the difference between them, the difference between a series of categories across a range of datasets.
And this is the trouble: because radar charts draw continuous lines, making complete shapes, they suggest causal and sequential relationships between those categories which, unless they’re days of the week or hours of the day, there rarely is.
Fortunately this problem is also its own solution. We can use radar charts to draw shapes - shapes that are more useful for tracing these relationships, like polar area charts, quadrants or thistledowns.
So, how do we make this in PowerPoint?
In this how-to, we’ll be using the default sample data PowerPoint gives you, so you can follow along without needing to download anything, but if you want to, you can find the dataset we used to make the example at the top, and a PowerPoint deck with that slide in, and other examples, here:
https://docs.google.com/presentation/d/1IbmUxJgxBtLa8x7QAGPTB62frOsBqTGg?rtpof=true&usp=drive_fs
What you’ll need
Radar chart with markers
Data manipulation
Design tweaks
How you do it
We’re going to use the radar chart to draw lines from the centre, ending in a marker for the data points. Because we’re using the actual values we can easily use the built-in data labels and legends to add detail to the chart.
Details
Insert the chart
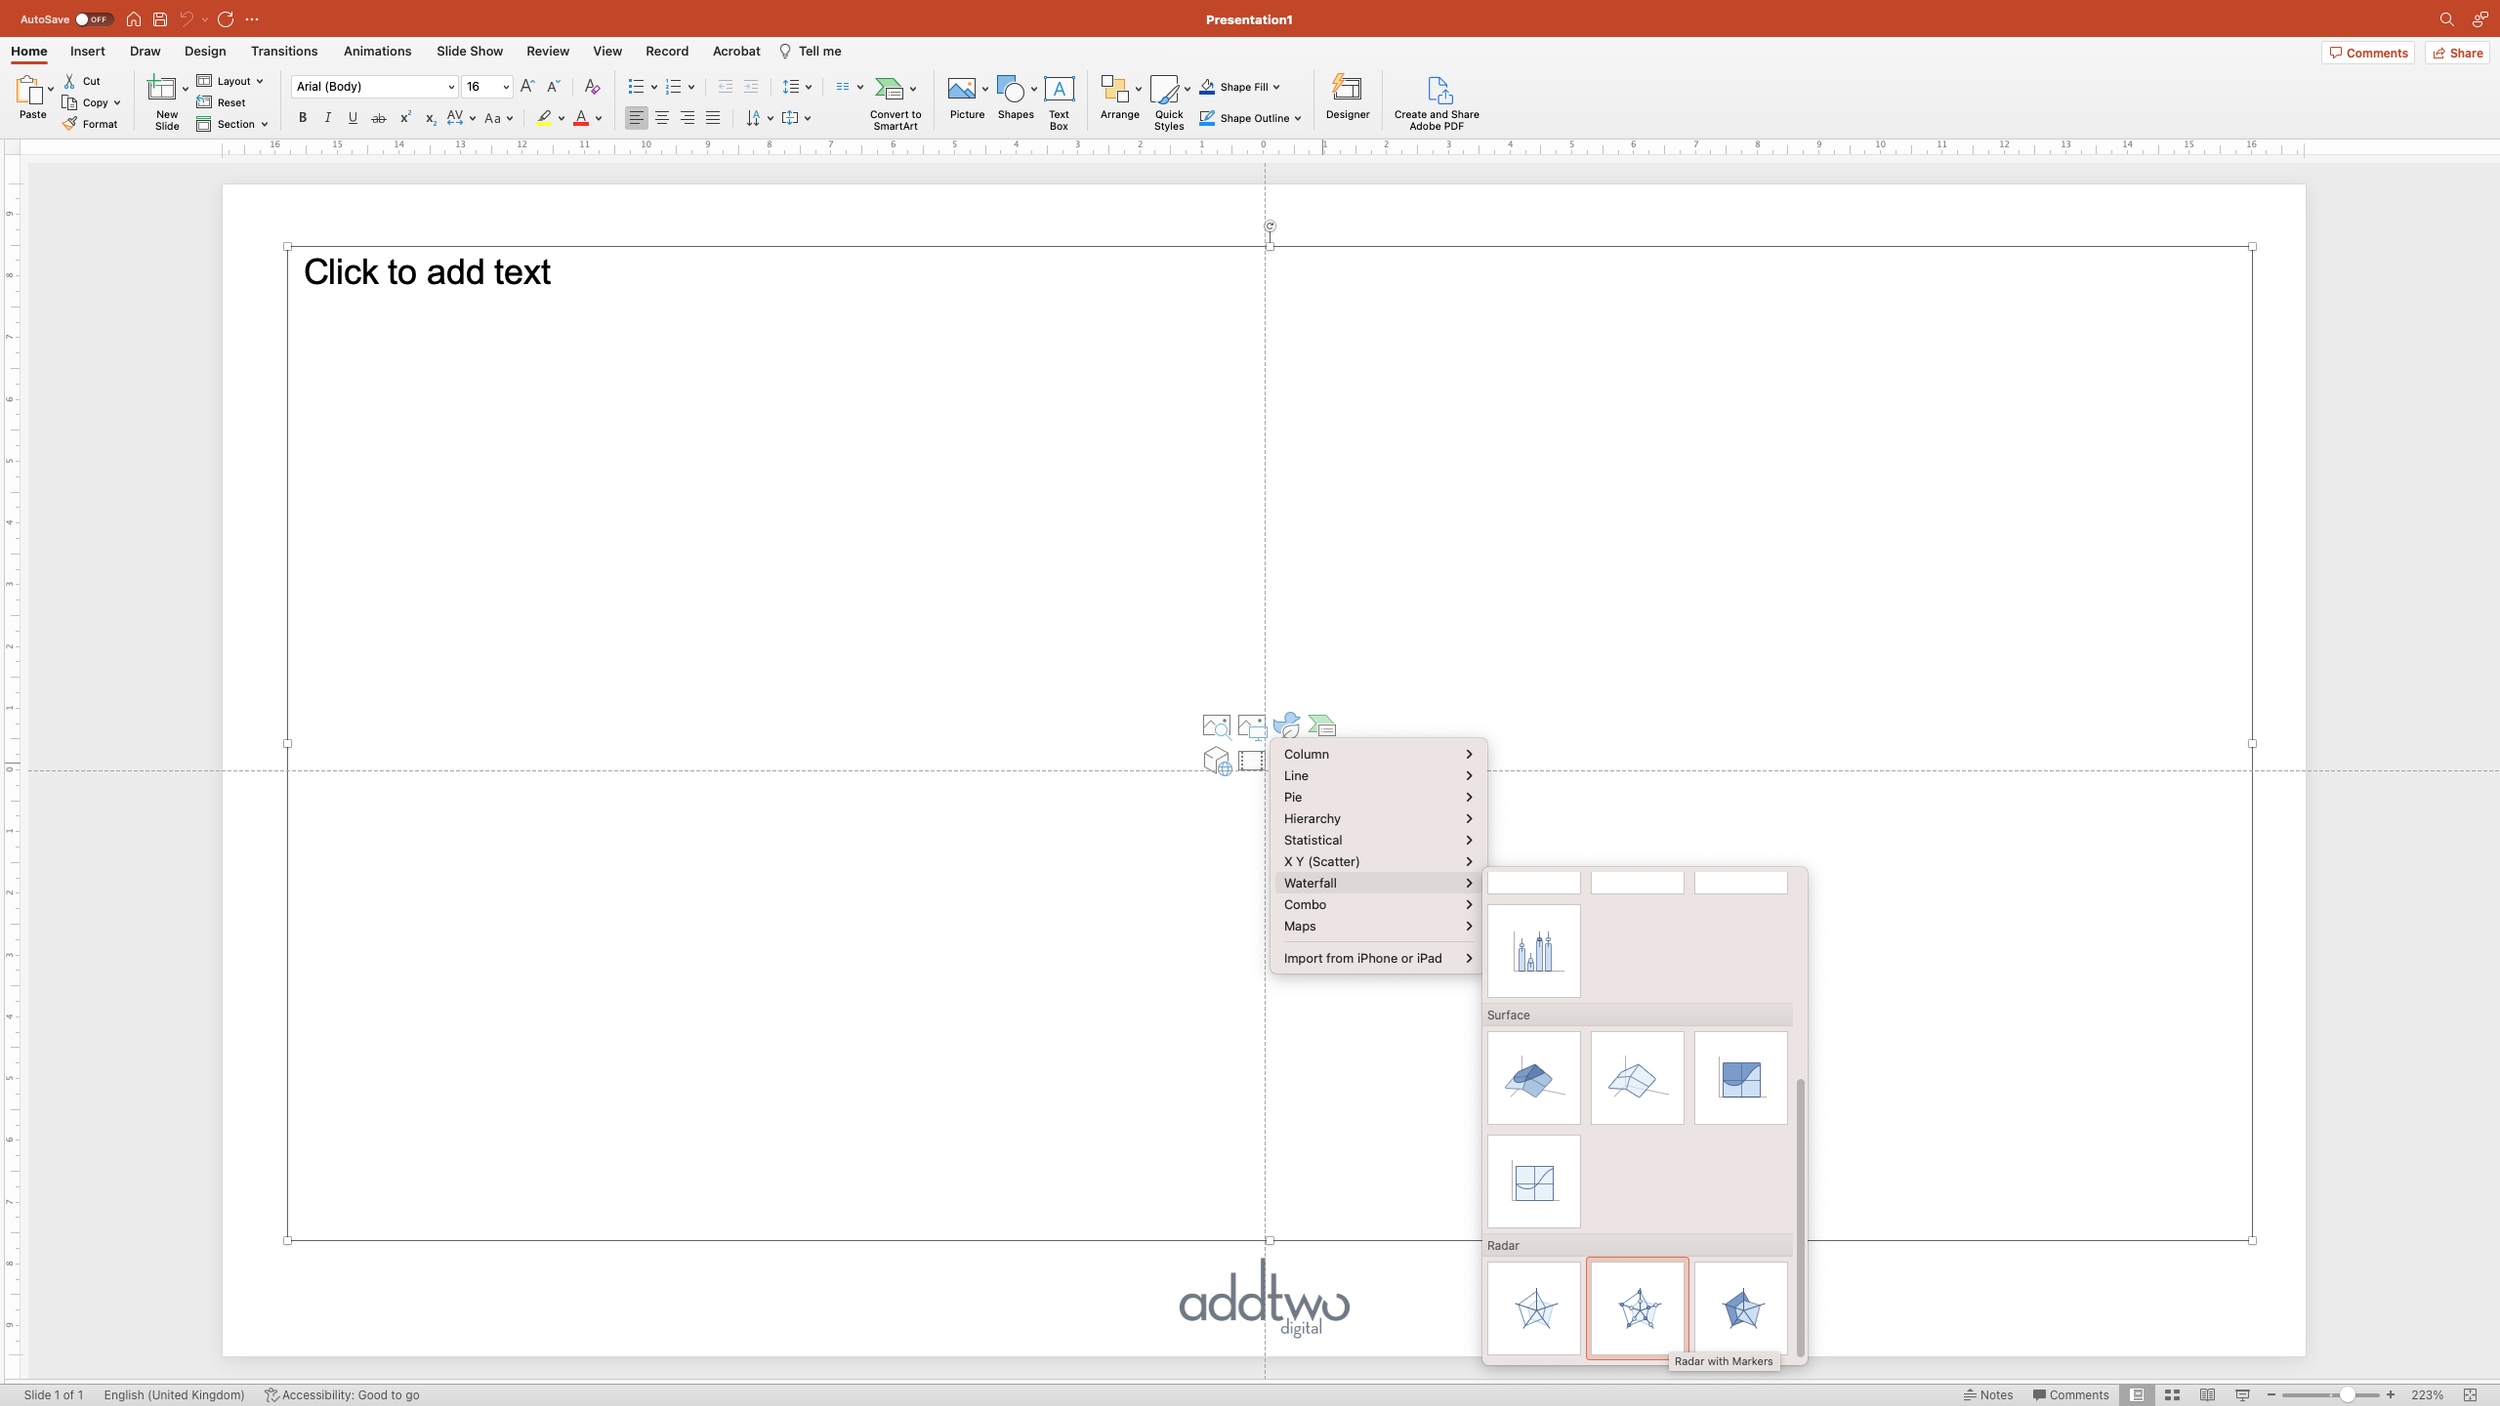
Add a Radar with Markers chart to the slide - they’re hidden away under ‘Waterfall’ charts in the menu for some reason:
As usual PowerPoint will insert a dummy chart and then open Excel to show the example data behind that chart

Although PowerPoint opens an entire Excel spreadsheet, it's only ever actually visualizing the data in the blue frame - we can move that frame around so we can work with the rest of the sheet and the PowerPoint chart won’t care.

This means we can have our data in a nice orderly table and then manipulate it to make the chart.

Manipulate the data
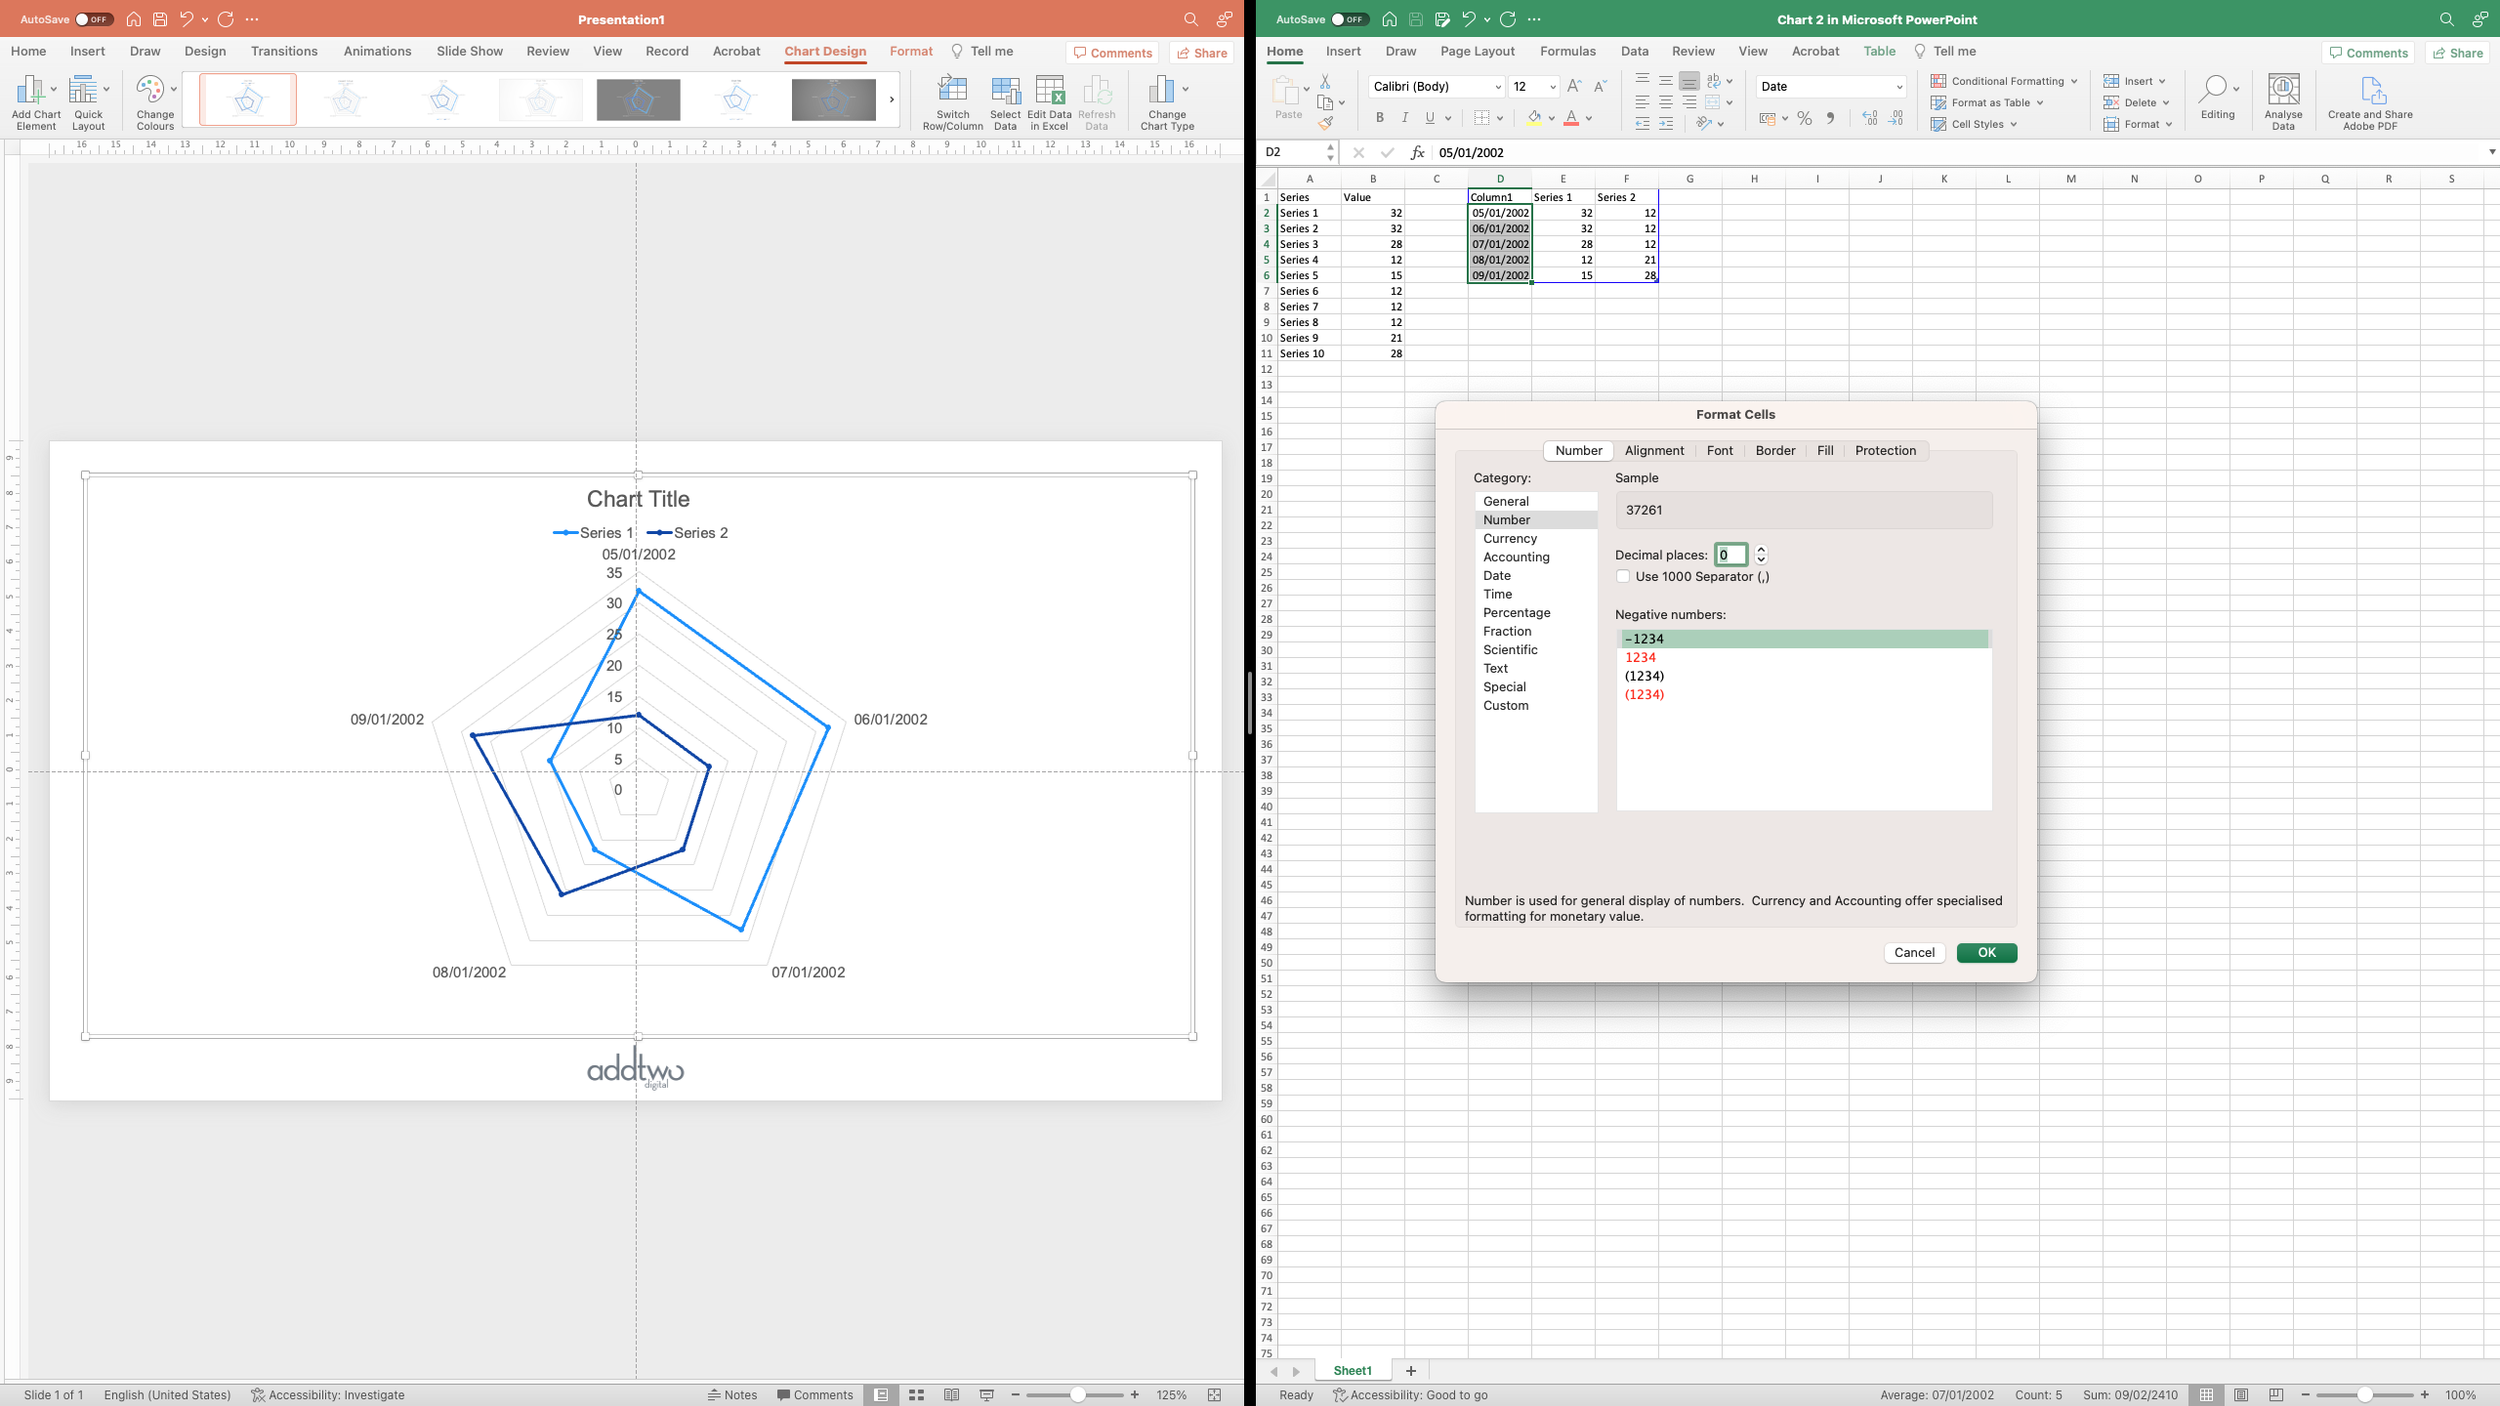
Firstly, that first column - the x axis around the outside of the radar chart - is in date format. We don’t actually need that, so we can reformat it to make it a little more legible. We can do this by selecting the cells and then changing the format, either using the Format menu or just right clicking and selecting ‘Format cells’.

We’re going to reformat them to just numbers.
This will give us some very weird looking results - if you’re interested in why, try investigating the ‘Unix Epoch’ and if that doesn’t sound enough like a beach-side spinner rack sci-fi novel to pique your interest, I don’t know what will.

Anyway, we can renumber that column to make more sense. We’ve got ten data points, so lets number it from 1 to 10.

Now we want to add our data.
Each data point is going to need it’s own series, so we can have each line coming from the centre outwards, so each data point is going to have to be in a separate column of y values.
To add to the complication, we’re going to want to draw round in a circle, so, for the moment, our first column is just going to be a single data point.

The second data point is where the fun really begins. Each data series needs to overlap with the previous, because we want it starting on the same radial as the previous data point. Each data series will also start with a ‘0’ because we want to draw a line from the centre of the visualisation out to the data point, which is our second row in this column.

We’re then going to repeat this for the other data points: creating a new column of y values, adding a 0 as the first entry and then our actual data point for the other.

We are going to follow that all the way down our column of data.

We’ll finish by adding a final ‘0’ in the first column, adding the start to our original data point.

Now we can close the data sheet and concentrate on the chart itself.
Design the chart
The first thing to do is to sort out the axes. The vertical axis is a bit busy and dominant, so we can simplify it a bit. Find the axis options in the Format Pane - the easiest way to do this is to right-click and select ‘Format Axis’ from the options.

Under the Axis options, we’ll set the Major Units to half the total value of the axis, giving us a halfway line.

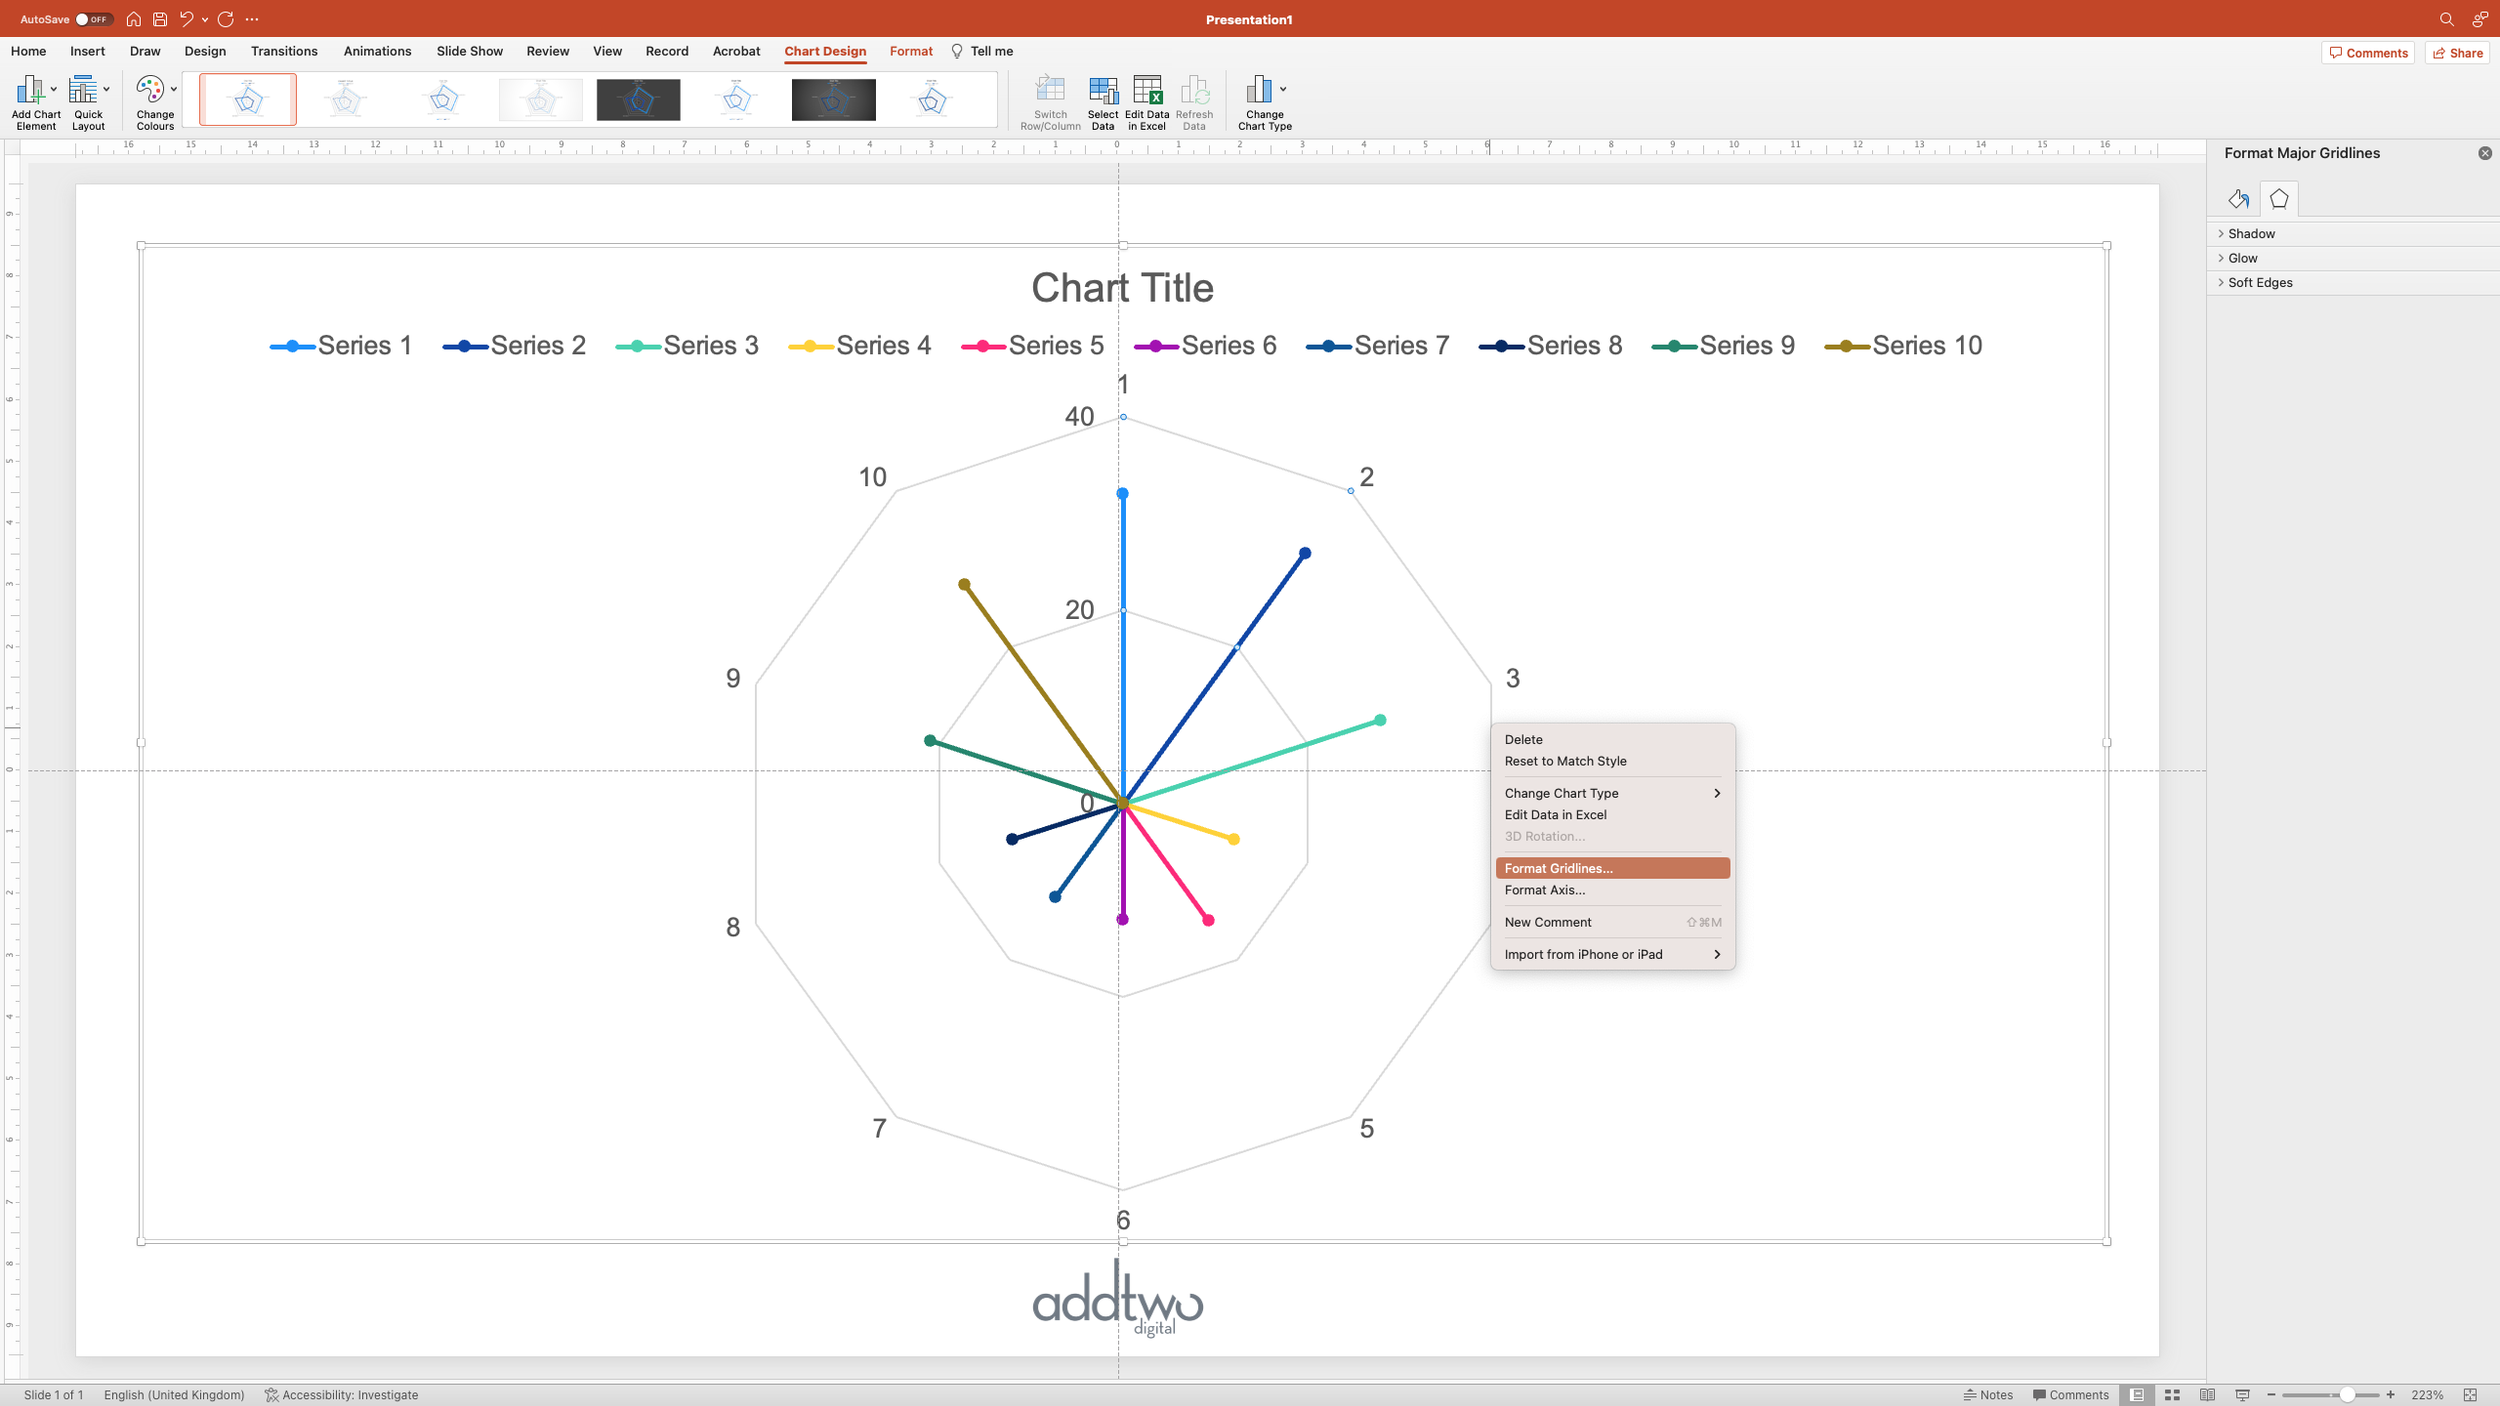
We could also calm those gridlines down a bit by selecting ‘Format Gridlines’
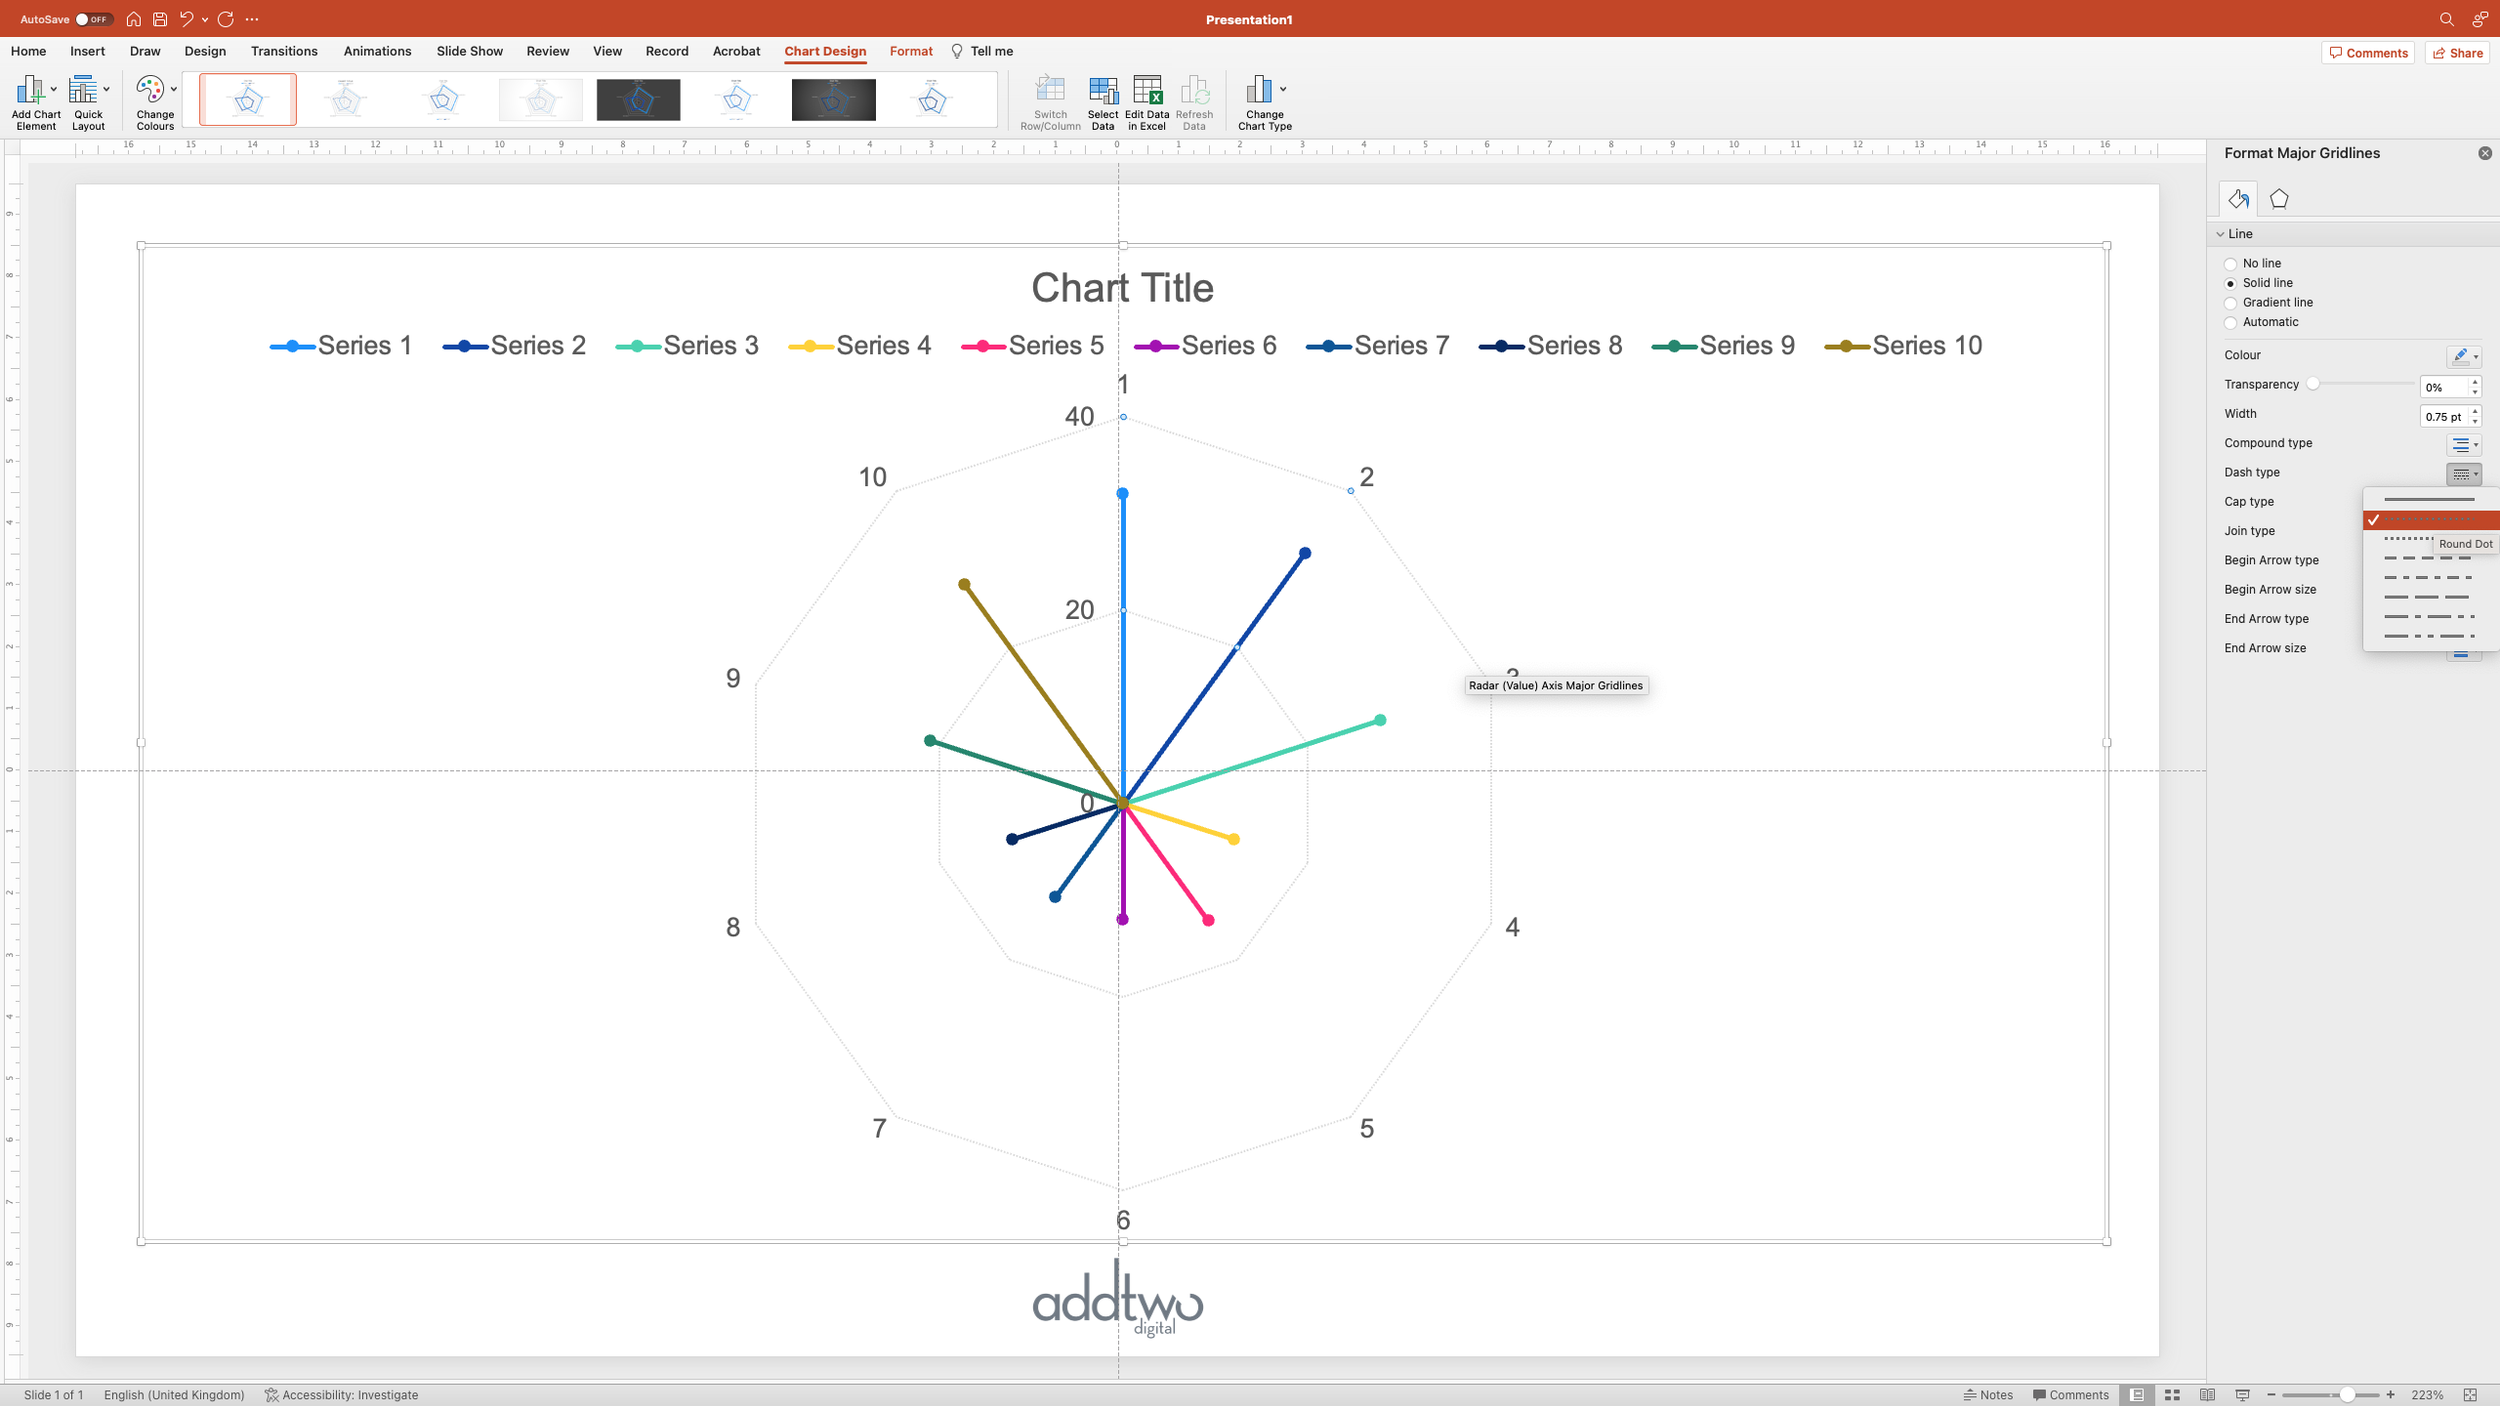
Then we can set them to a dotted line, making them a little visually lighter.
As far as the axis around the outside goes, we don’t need it at all, it’s simply there to arrange the data, so we can go ahead and delete it.

Now we want to style up the data points
Style the data points
We’re going to start by selecting the last of the data series. This is simply because its slightly easier to go anti-clockwise around the chart. Open the Format Pane for that data series.

The Format Pane should default to the options for the line. Here we can set the line width and colour we want.

Then we can switch to the Marker settings using the buttons at the top of the panel. If we then open the Marker Options we can set the marker style and size.

We can then set the marker colour to match the line (and also remove the border by setting it to ‘No line’).

Then we want to select the bottom marker, the one in the centre of the chart. Clicking it twice should select it: once selects all the markers, twice the marker you’ve clicked on.

Set this marker to ‘None’ in the Marker Options panel. This will remove that central marker, leaving the one on the end of the line.

There is an alternative way of doing this: you can remove all the makers and use the End Arrow options for the line itself to add a circle onto the end of it, although this gives you less control over size and appearance (and PowerPoint can be a little fussy about it, too).
We then repeat that process for all the data series.

So that’s how we make that in PowerPoint
And here’s where I admit that I made up the name ‘thistledown’. I’m not sure this chart has a proper name, but they are useful alternatives to radars when you want to use multiple charts to allow the audience to see differences between data series across multiple categories.
There are also lots of different styling options, using different markers or line arrows, or even not having markers at all and just letting the lines make a star shape - especially if you add a little transparency to thick lines and generate a little starburst in the centre of each chart.
