In this blog series, we look at 99 common data viz rules and why it’s usually OK to break them.
by Adam Frost
The default thickness of lines in most tools is around 2 points, give or take. Illustrator is exactly 2pt, Powerpoint is 2.25pt, Flourish uses rems (a multiple of the page’s base font size) and starts at 0.2 rems, but it ends up looking about 2pt. Much thinner than this, and it’s hard to distinguish between the lines, particularly with similar or pale colours. Much thicker, and the lines fight (one has to be on top), and the changes in direction get smudged.
But the story doesn’t always end there. In many instances, you will want to override the 2pt default to ensure the meaning of your chart is clear.
i) lots of change
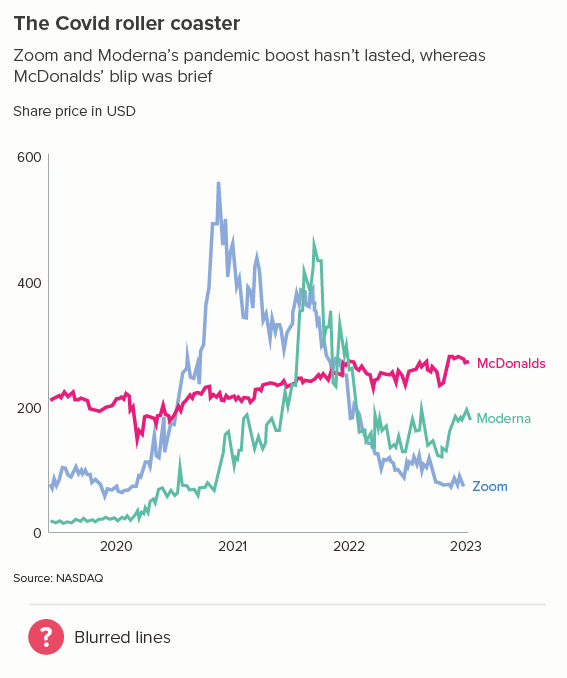
The more movement there is in your line, the thinner you will usually make it. Think stock market lines, where it is important that key fluctuations are clearly delineated.
ii) lots of lines
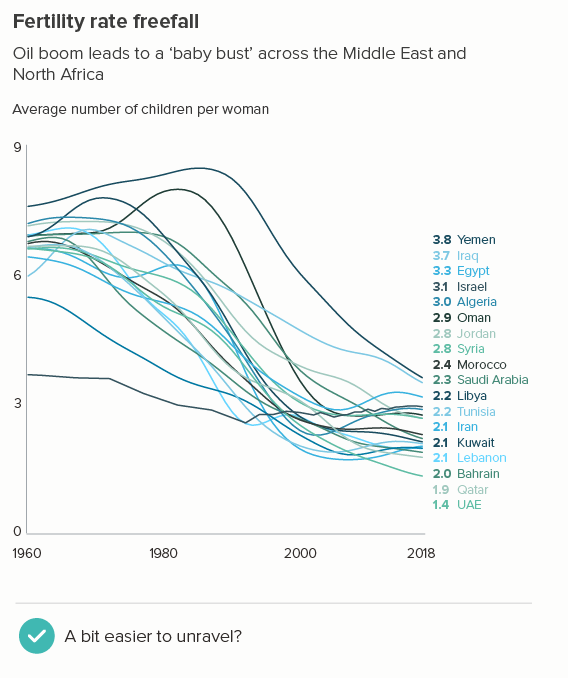
The more lines you have, particularly if some of them are close together, the more they will compete with each other. Making them thinner helps them all become more visible. Of course ideally you’d try to delete or highlight some of the lines (see the next section), but sometimes this isn’t possible or permissible (all lines must be treated equally).
iii) one line matters more
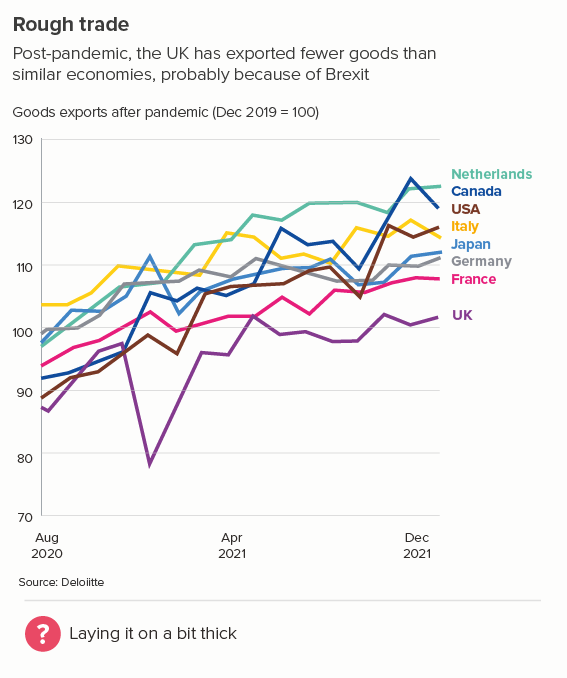
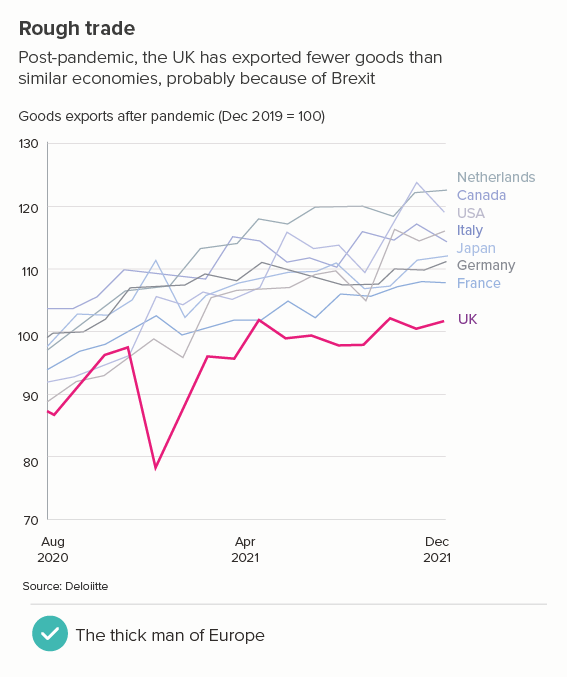
This is the most common use case. You are trying to isolate a particular line, perhaps because it is most important, or because it is the most interesting. So this line becomes thicker (and/or a more dominant colour) and the others recede. Remember, for a lot of software (e.g. PowerPoint), you will also want to put this line last in your datasheet so it sits on top of the others.
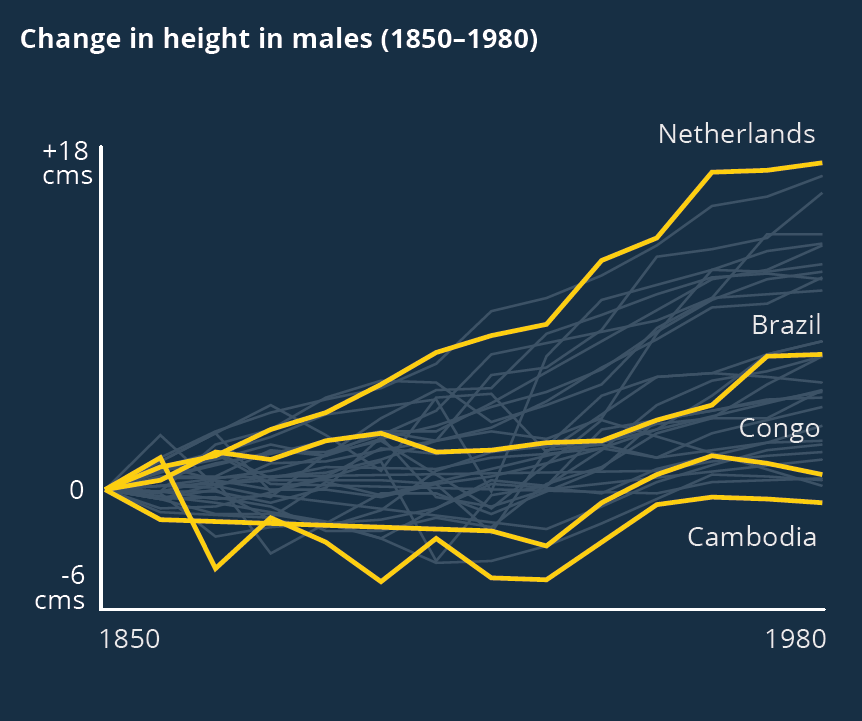
Sometimes (if it is global data), you might want to treat several lines in this way, e.g. thicken four or five lines and knock back the others, as in the first chart below. Usually you thicken the lines that finish top and bottom, and then a selection of lines in the middle.
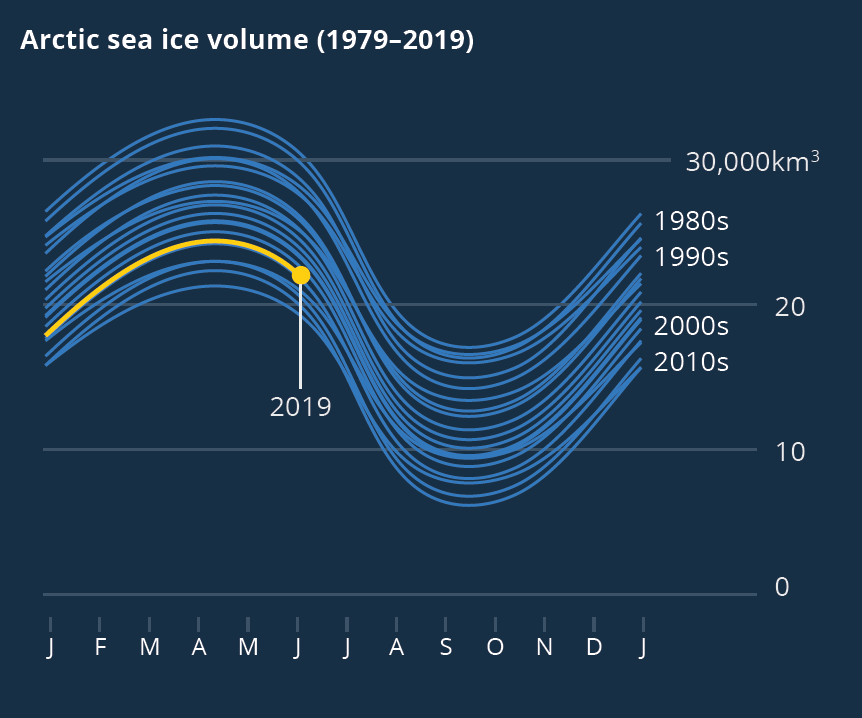
Playing with line thickness is also useful for cyclical data (the second chart below). In other words, when you are overlaying lots of lines on a line chart to represent daily or annual change. Climate change data is frequently represented in this way, and the latest year is usually the thicker line.
iv) a change in meaning
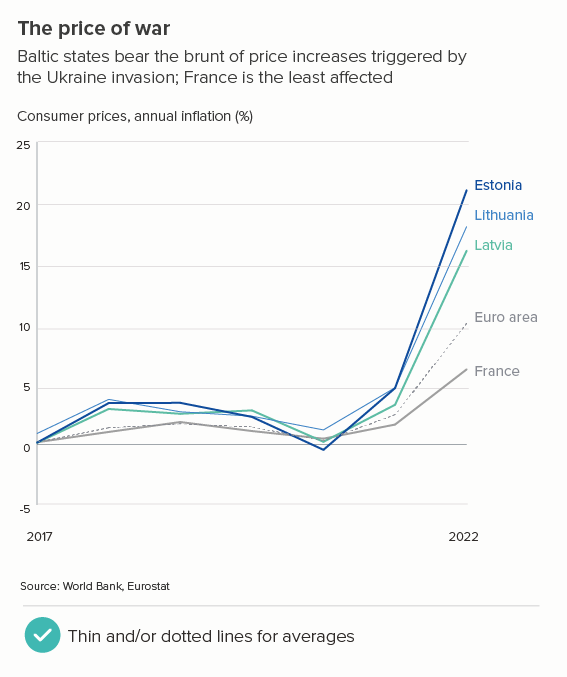
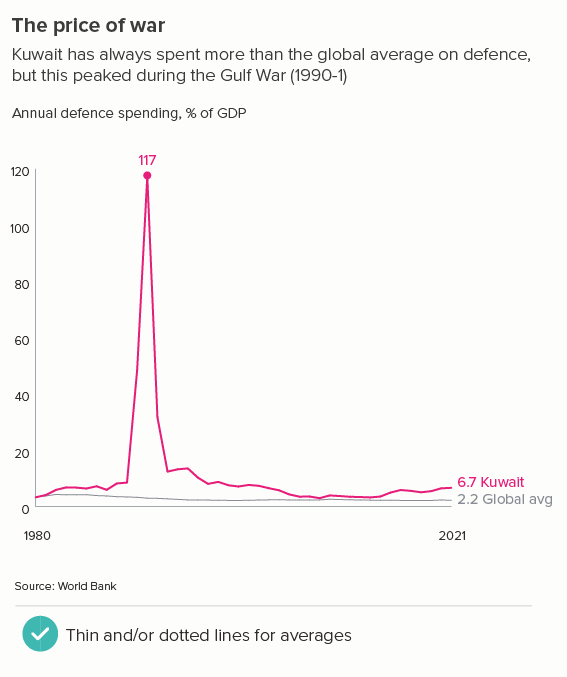
Sometimes one of your lines is different from the others - maybe it’s an average. Or a line can change its meaning - perhaps there is missing data, or after a certain date it’s a projection. These use cases can mean the default line style changes - either its width, or opacity, or a solid line becomes dashed.
v) an aesthetic choice
When you’re talking to a general audience, you often need a bolder approach. So you might make your lines thicker, or change their colour half way along, or make them part of a larger visual. Here the thickness of your lines will vary, and depend on your choice of metaphor. Nigel Holmes is a pioneer of this approach (one of his graphics is included below), but you will see similar techniques in the work of Peter Grundy, Valentina D’Efilippo, David McCandless and others. If you have an expert audience, this can backfire (‘you cannot be serious’), but I think - with the right data - graphics like this are great fun.
Source: Nigel Holmes
VERDICT: Break this rule sometimes
Sources: Stock prices - NASDAQ, Fertility rates - World Bank, Brexit trade - Deloitte, Inflation - World Bank, Defence spending - World Bank, Nigel Holmes graphic on virginity by Nigel Holmes

