
key resources

COMMUNICATING WITH DATA VISUALISATION
Based on our long-running Guardian masterclass, our book provides an accessible, nuts-and-bolts exploration of how to turn a spreadsheet into a clear and beautiful visual.
99 DATA VIZ RULES - & WHY IT’S OK TO BREAK THEM
Adam Frost sense checks every data viz rule he can find to see if it holds up under pressure and tries to suggest best practice when they don’t.

HOW DO I MAKE IT IN POWERPOINT?
Tobias Sturt walks through a series of tutorials on how to manipulate the Microsoft Office charting engine to make bespoke, non-standard charts.
Book

Downloads
Download resources to accompany our book, including sample chapters and best practice examples.

TOP 10 DESIGn hacks
A selection of favourite chart design tips from the book that (almost) always work

10 Illustrator Tips
Adam’s top 10 favourites tips on making data visualizations in Adobe Illustrator
99 DATA VIZ RULES

RULE 18: DON'T USE MULTI-COLOURED BARS
Although you shouldn’t go full Austin Powers, it’s still a good idea to work out when you can brighten up your bars. As always, the guiding principle should be: does this illuminate the story?

RULE 8: LIMIT THE NUMBER OF COLOURS IN YOUR PIE CHARTS
Most of us are not professional designers and have no idea which colours sit well together. The people who develop software applications seem to have no idea either.

RULE 15: DON'T USE DOUGHNUT CHARTS?
‘Donuts? Is there anything they can’t do?’ mulls Homer Simpson. Quite a lot, it turns out, when you turn them into charts, but that still doesn’t mean you shouldn’t use them.
How to make it in PowerPoint

WAFFLE CHARTS (SINGLE SERIES)
There are multiple ways to make waffle charts in PowerPoint by using columns, stacked columns or scatter plots. In this case we’re going to make a waffle showing a single percentage using a simple stacked column chart

Bullet Charts
Bullet charts (originally developed by Stephen Few) are bar chart replacements for gauges and meters. They allow us to measure values both against a range and in comparison to a target.
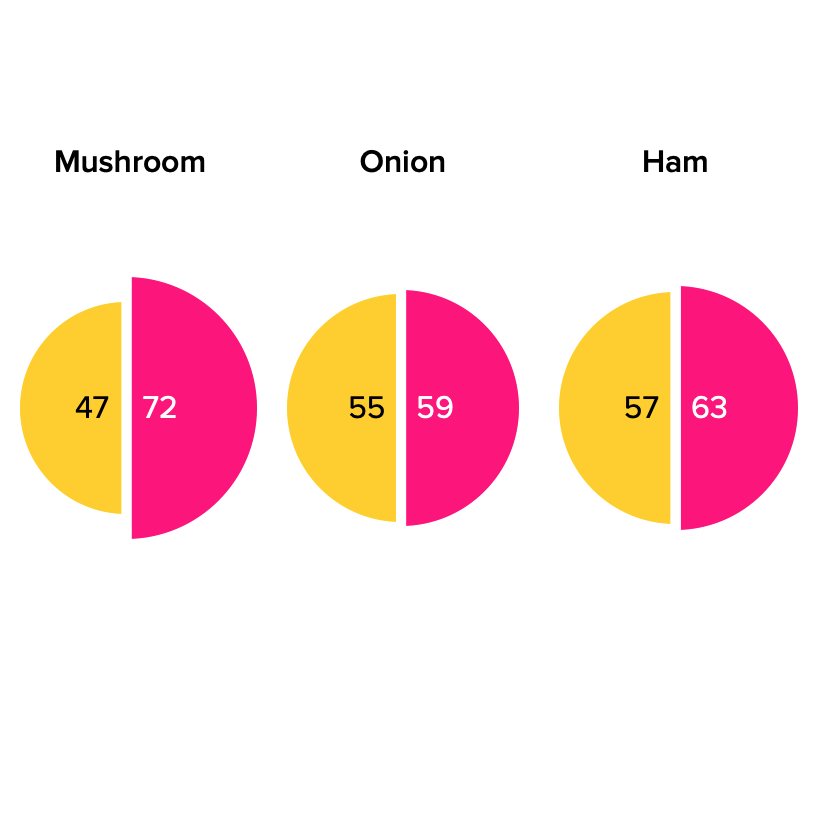
Split Circles
Split circles are a nicely attention grabbing way to visualise comparisons, especially a before and after, or two regions/demographics/departments.